Fab Modules
kokopelli documentation
About
This page describes libraries, data structures and render parameters relevant to writing design scripts in kokopelli. It is not appropriate as a general introduction to script-based design; for that, we recommend the (slightly outdated) tutorials found here.
Libraries and the MathTree data structure
Three standard libraries are included:
koko.lib.shapes2ddefines 2D shapes and transforms.koko.lib.shapes3ddefines 3D shapes and transforms.koko.lib.textdefines a font and text generation function.
For convenience, we also provide koko.lib.shapes, which combines the first
two libraries.
The functions in these libraries return Python objects of class MathTree.
A MathTree object contains the following member variables:
ptr: a pointer to a C data structureshape: a boolean that modifies the meaning of certain operations (e.g. A+B changes from numerical addition to logical combination ifshapeis True in A or B)color: a 3-item tuple containing an RGB color value (on a 0-255 range)bounds: an array of threeIntervalobjects, containing bounds on X, Y, and Z axes.
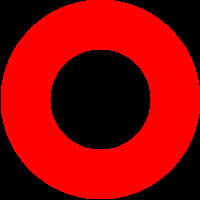
Color
The color parameter can be set by designers.
It accepts either a three-item tuple or a string from a set of pre-defined colors.
The pre-defined colors are red, blue, green, white, grey, black, yellow, cyan, and magenta; each of is tranformed into the appropriate RGB values when set.
|
 |
Object bounds
Each MathTree stores its own bounds (which may be None if appropriate bounds are not known). These bounds are used when exporting and when creating meshes for shaded rendering.
If Z bounds are unknown (e.g. in 2D design work), the height-map renderer will use (0,0). All three axes must be bounded to use the shaded renderer.
Individual bounds should be accessed using the properties xmin, xmax, ymin, ymax, zmin, and zmax. These properties safely access the bounds array, returning None if the bounds are not defined on that axis.
If you are using the standard libraries, bounds will automatically be created and propagated using interval arithmetic.
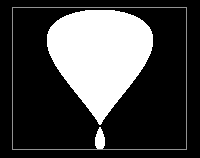
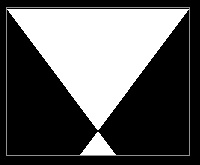
The automatically propagated bounds may not be as tight as possible. This is most noticeable when performing coordinate transforms that substantially distort the shapes.
Compare the following two examples. In the first example, the auto-propagated bounds are not optimal, because they are bounding the largest possible output (shown in the second example).
|
 |
|
 |
Bounds can be displayed with the option "Show bounds" in the View menu.
Rendering parameters
In the examples above, we select what to render by assigning it tocad.function.
At evaluation-time, cad is an instance of the FabVars class, with the following member variables:
shapes: list ofMathTreeobjects to renderrender_mode: eitherNone, 'height', or 'shaded'; defaults toNonemm_per_unit: a floating-point value; defaults to 25.4 (i.e. 1 inch per unit)
The aforementioned function is a property that accesses the first item in shapes.
The parameter render_mode allows a script to dictate whether we render as a height map or as a shaded solid. When it is set to a value other than None, it will disable the corresponding options in the View menu.
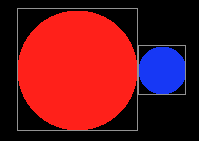
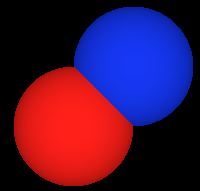
Multi-object rendering
The parameter shapes takes a list of MathTree objects. Each shape is rendered separately, with its own bounds and coloring.
|
 |
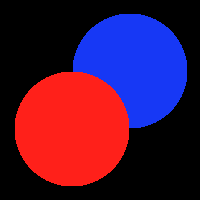
When multiple objects overlap, they are culled based on height.
|
 |
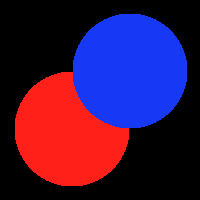
When objects of the same height overlap (as is the case in many 2D designs), the first object listed takes priority in the height-map rendering. Compare the following two designs:
|
 |
|
 |
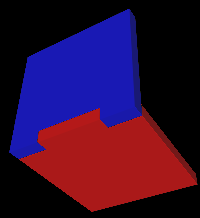
These features are especially useful when visualizing 3D press-fit structures. Per-object meshing prevents meshes from merging together and per-object coloring makes it easier to distinguish between different parts of a complete model
|
 |